
When you are looking for your next role after a long career, a national total offers limited guidance unless you know where contracts are registered, which employers account for them and which functions feature most. The August 2026 edition of the Executive Employment Observatory examines those questions using data from Spain's public employment service, SEPE.
Between January and August, Spain registered 33,527 contracts for management positions, compared with 31,751 in the same period of 2025: an increase of 5.6%. Contracts across all occupations grew by 4.9%. August accounted for 2,822 contracts for management positions, compared with 2,618 in August 2025. The cumulative figures provide context without confusing seasonal patterns with a trend.
Madrid and Barcelona account for half
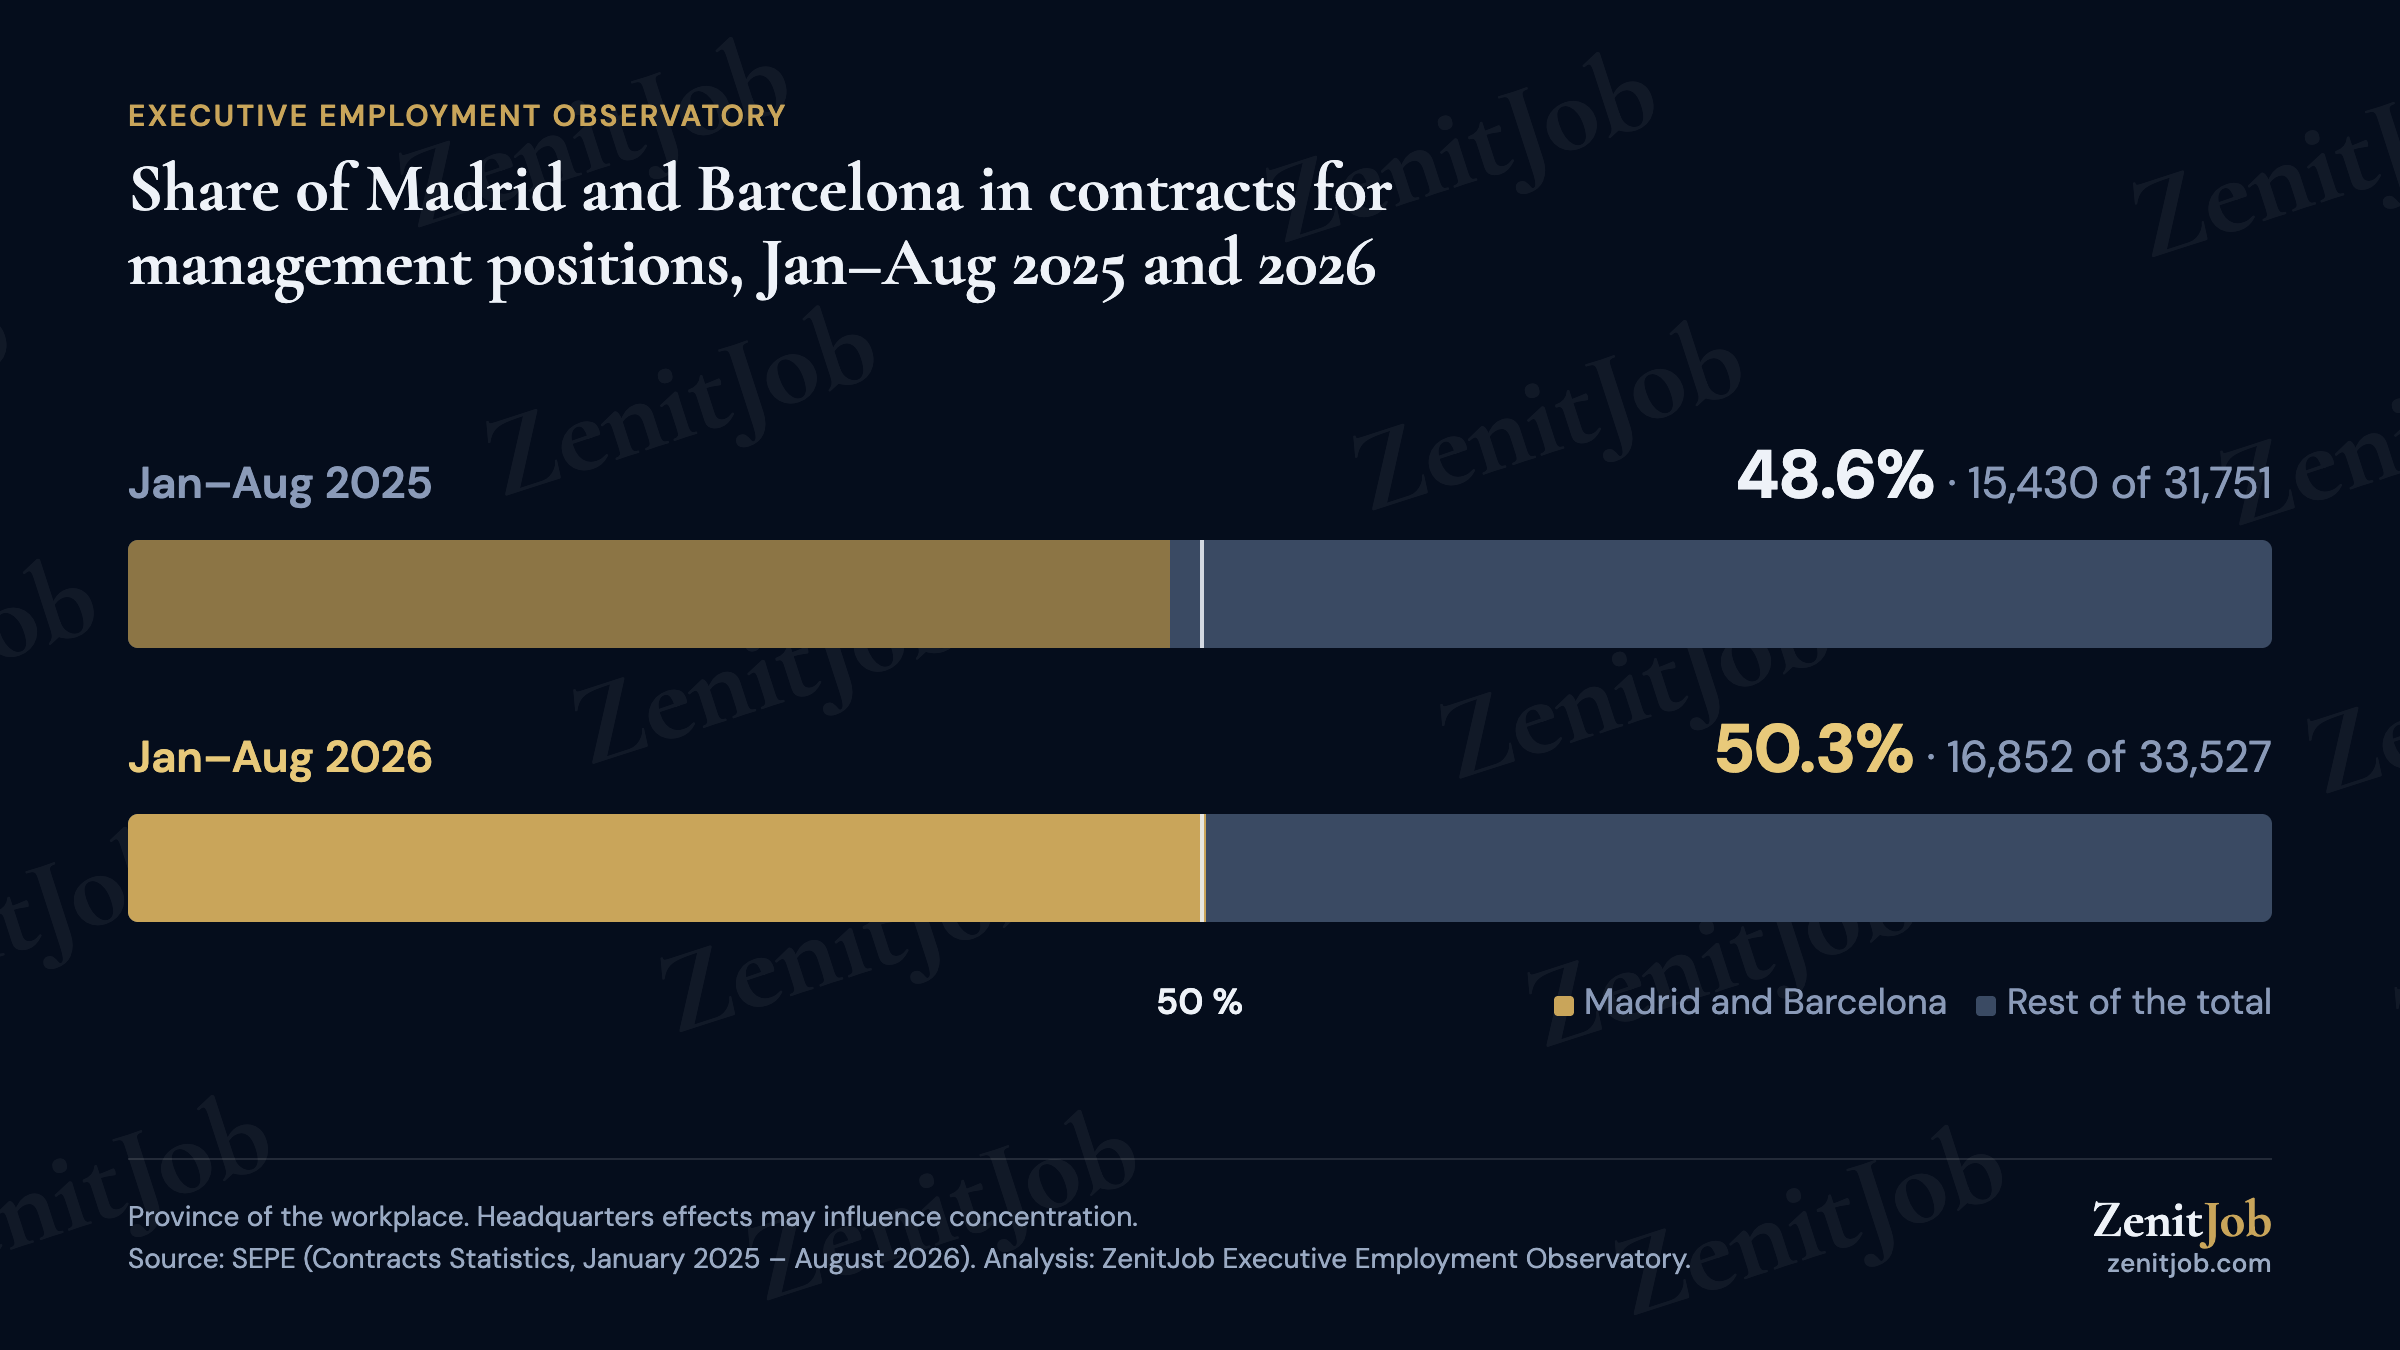
The Community of Madrid and the province of Barcelona account for 50.3% of contracts for management positions registered between January and August 2026, compared with 48.6% in the same period of 2025. Madrid accounts for 10,203 contracts and Barcelona for 6,649.
If you are looking elsewhere, that concentration provides useful context about the geographical distribution of registered contracts. The province refers to the workplace, not the individual's home address. It does not identify whether a role allows remote working. These figures alone cannot justify a decision to relocate.
Other locations show different patterns. Valencia registered 1,733 contracts, up 15.1% year on year; Seville registered 896, up 12.3%; and the Balearic Islands registered 1,215, down 3.1%. Volume and growth answer different questions: faster growth does not necessarily mean more contracts.
Smaller businesses have a substantial role
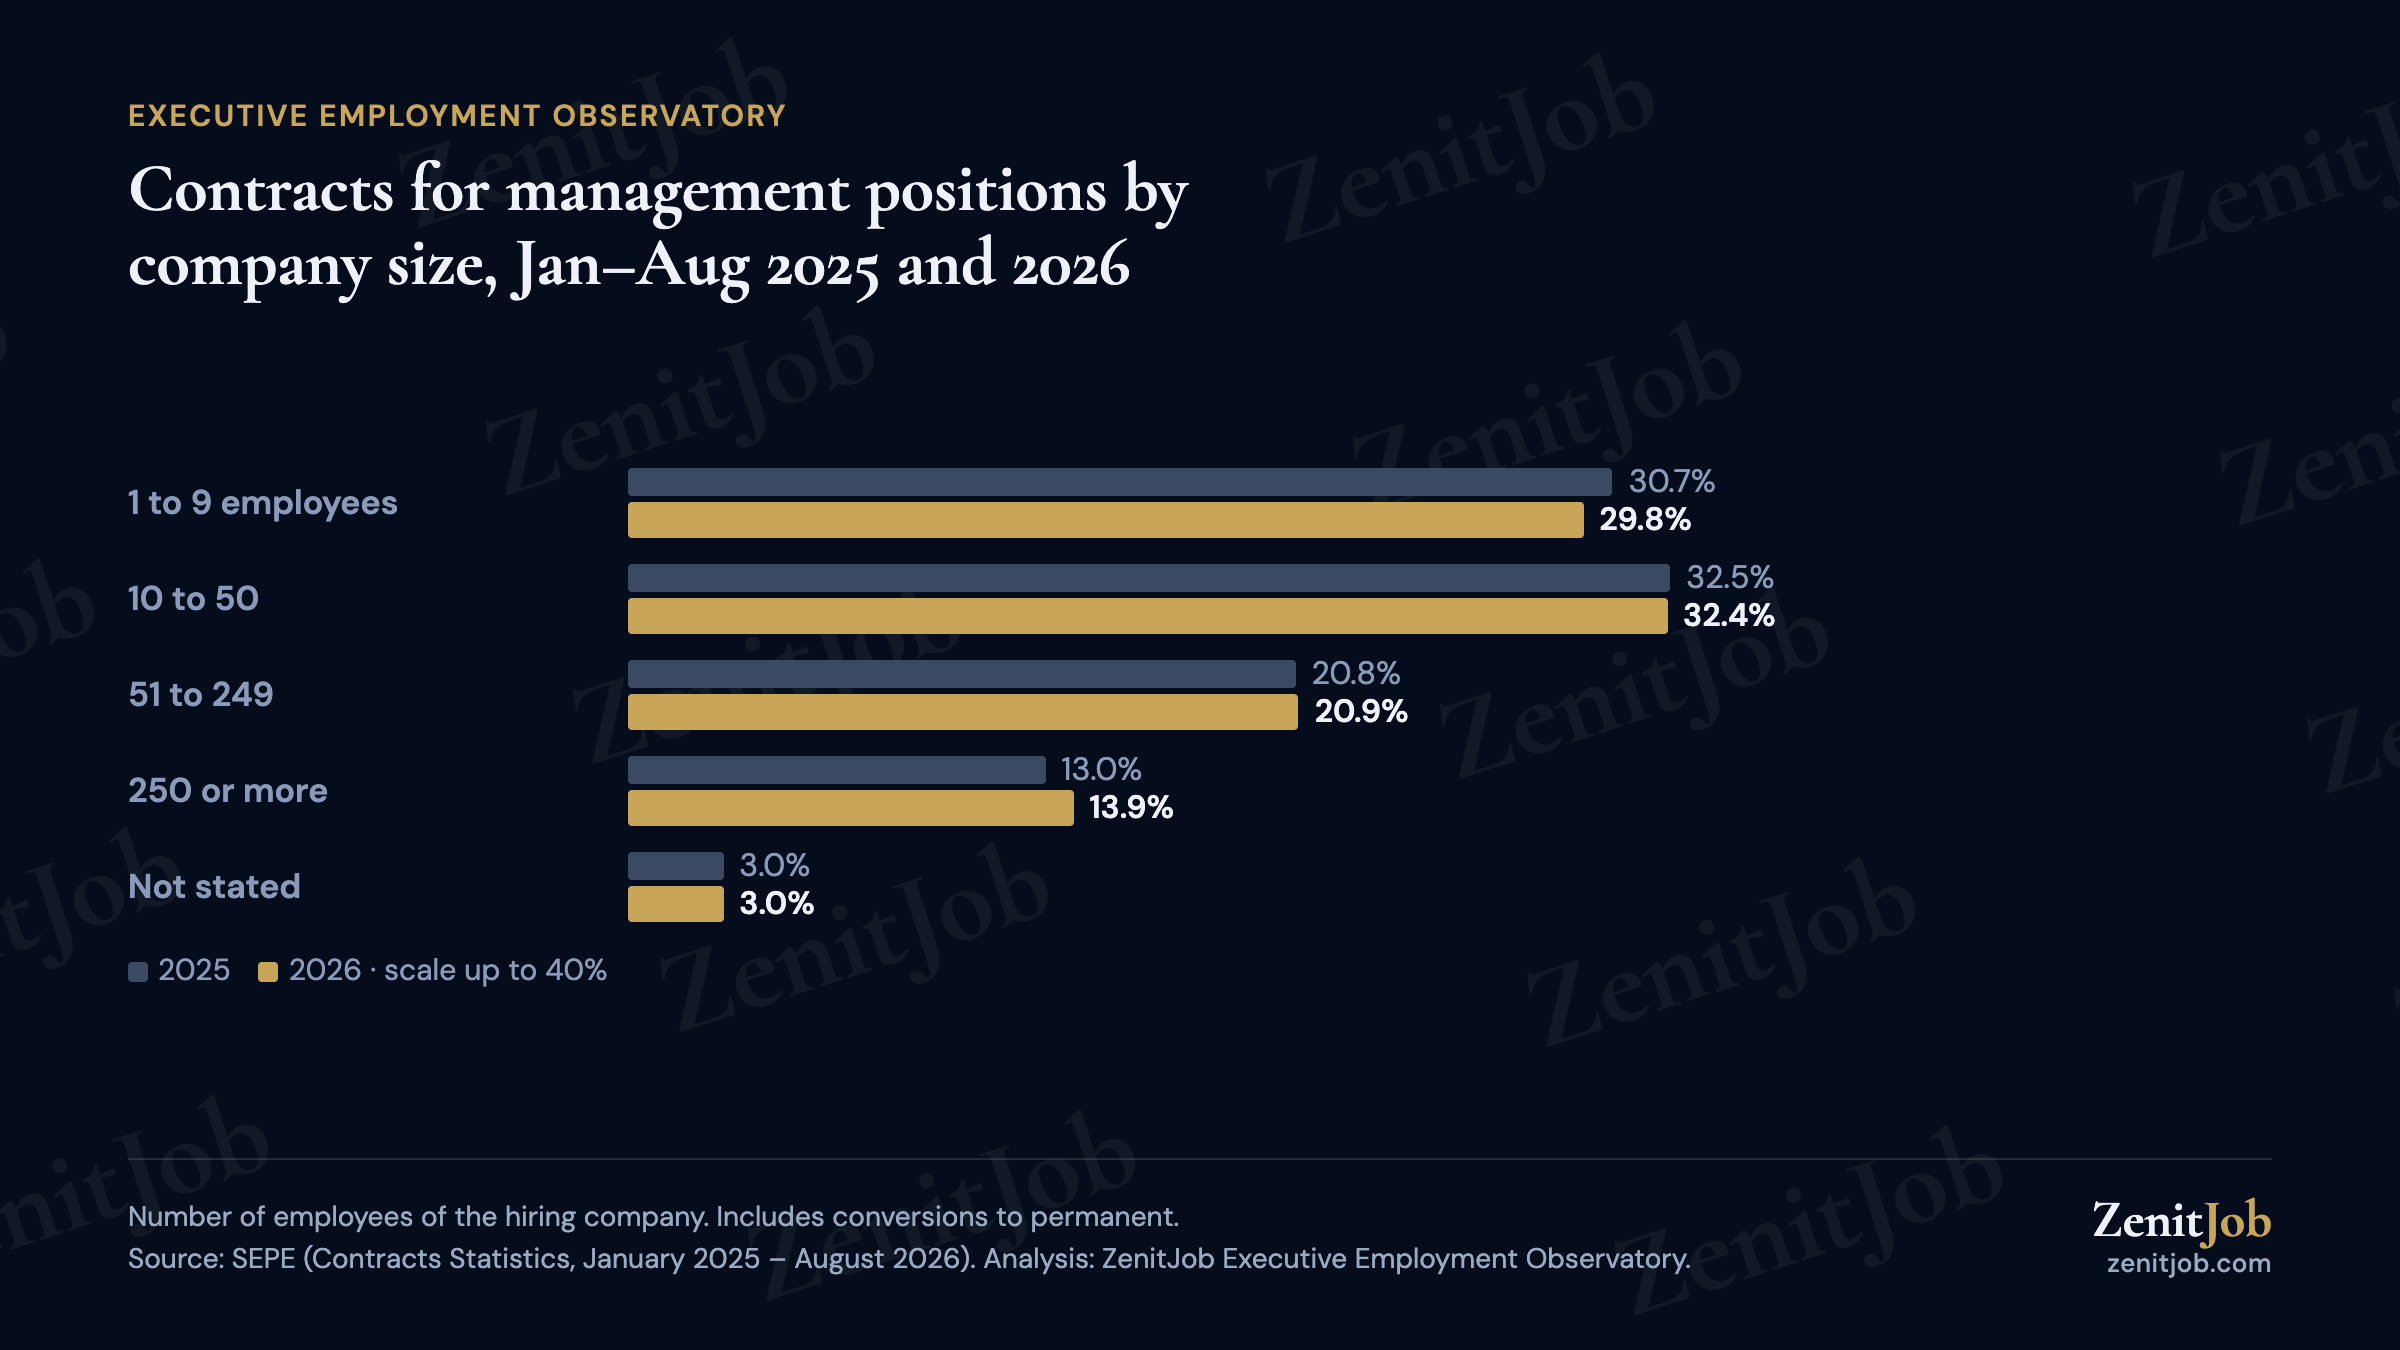
A search for a management position can bring large organisations to mind. The distribution by employer size broadens that picture. Microbusinesses account for 29.8% of records, small businesses for 32.4% and medium-sized businesses for 20.9%. Large businesses represent 13.9%, while employer size is unavailable for 3.0%.
This breakdown uses a base of 33,984 records because it includes conversions to permanent contracts. That differs from the 33,527 initial contracts used for the overall total, provinces and occupational groups. The sector breakdown also uses the base of 33,984.
For an experienced professional, this distribution shows that contracts for management positions are registered across businesses of different sizes. It does not reveal the autonomy, budget or team attached to a role, or whether a particular employer currently has an opening.
Which functions feature most?
Administrative and commercial department management accounts for 17,239 contracts, or 51.4% of the total. This broad category includes functions such as finance, human resources, sales and marketing. The aggregate figure does not establish the share belonging to each function.
Production and operations management represents 22.2%, with 7,430 contracts. Accommodation, food service and retail management accounts for 14.1%. These categories help place a functional career background in context, but they do not measure an applicant's chances of selection or provide findings specific to their age.
Sectors show the current distribution
Wholesale and retail trade accounts for 14.9% of records in the sector breakdown, followed by professional, scientific and technical activities at 13.0% and accommodation and food services at 12.5%. These categories describe the employer's activity, which is different from the function performed in a management role.

What this means for your search
The Observatory brings geography, employer size and function into the same view of the market. It does not cross-reference those dimensions to establish which combination offers the most opportunities. Nor does it report salaries, available vacancies or employer names.
These are contracts for management positions, classified by the occupation declared by the employer. A contract is not a person, and this statistical category does not identify Spain's special senior executive employment contracts. The figures offer verifiable context for a search, without turning recorded activity into a prediction for an individual candidate.
Read the full August 2026 edition and its press release.
Data source: SEPE (Contract Statistics, January 2025 to August 2026). Analysis: ZenitJob Executive Employment Observatory.